Guide

How to use PosturaScreen — step by step.

From your first sign-in to a finished PDF report, the whole workflow takes a couple of minutes. The steps below work for both clinic practitioners and individuals screening themselves.

Clinic / practitioner Solo / personal use

The flow is the same for both — wherever it differs, look for the clinic or solo tag on the step.

1

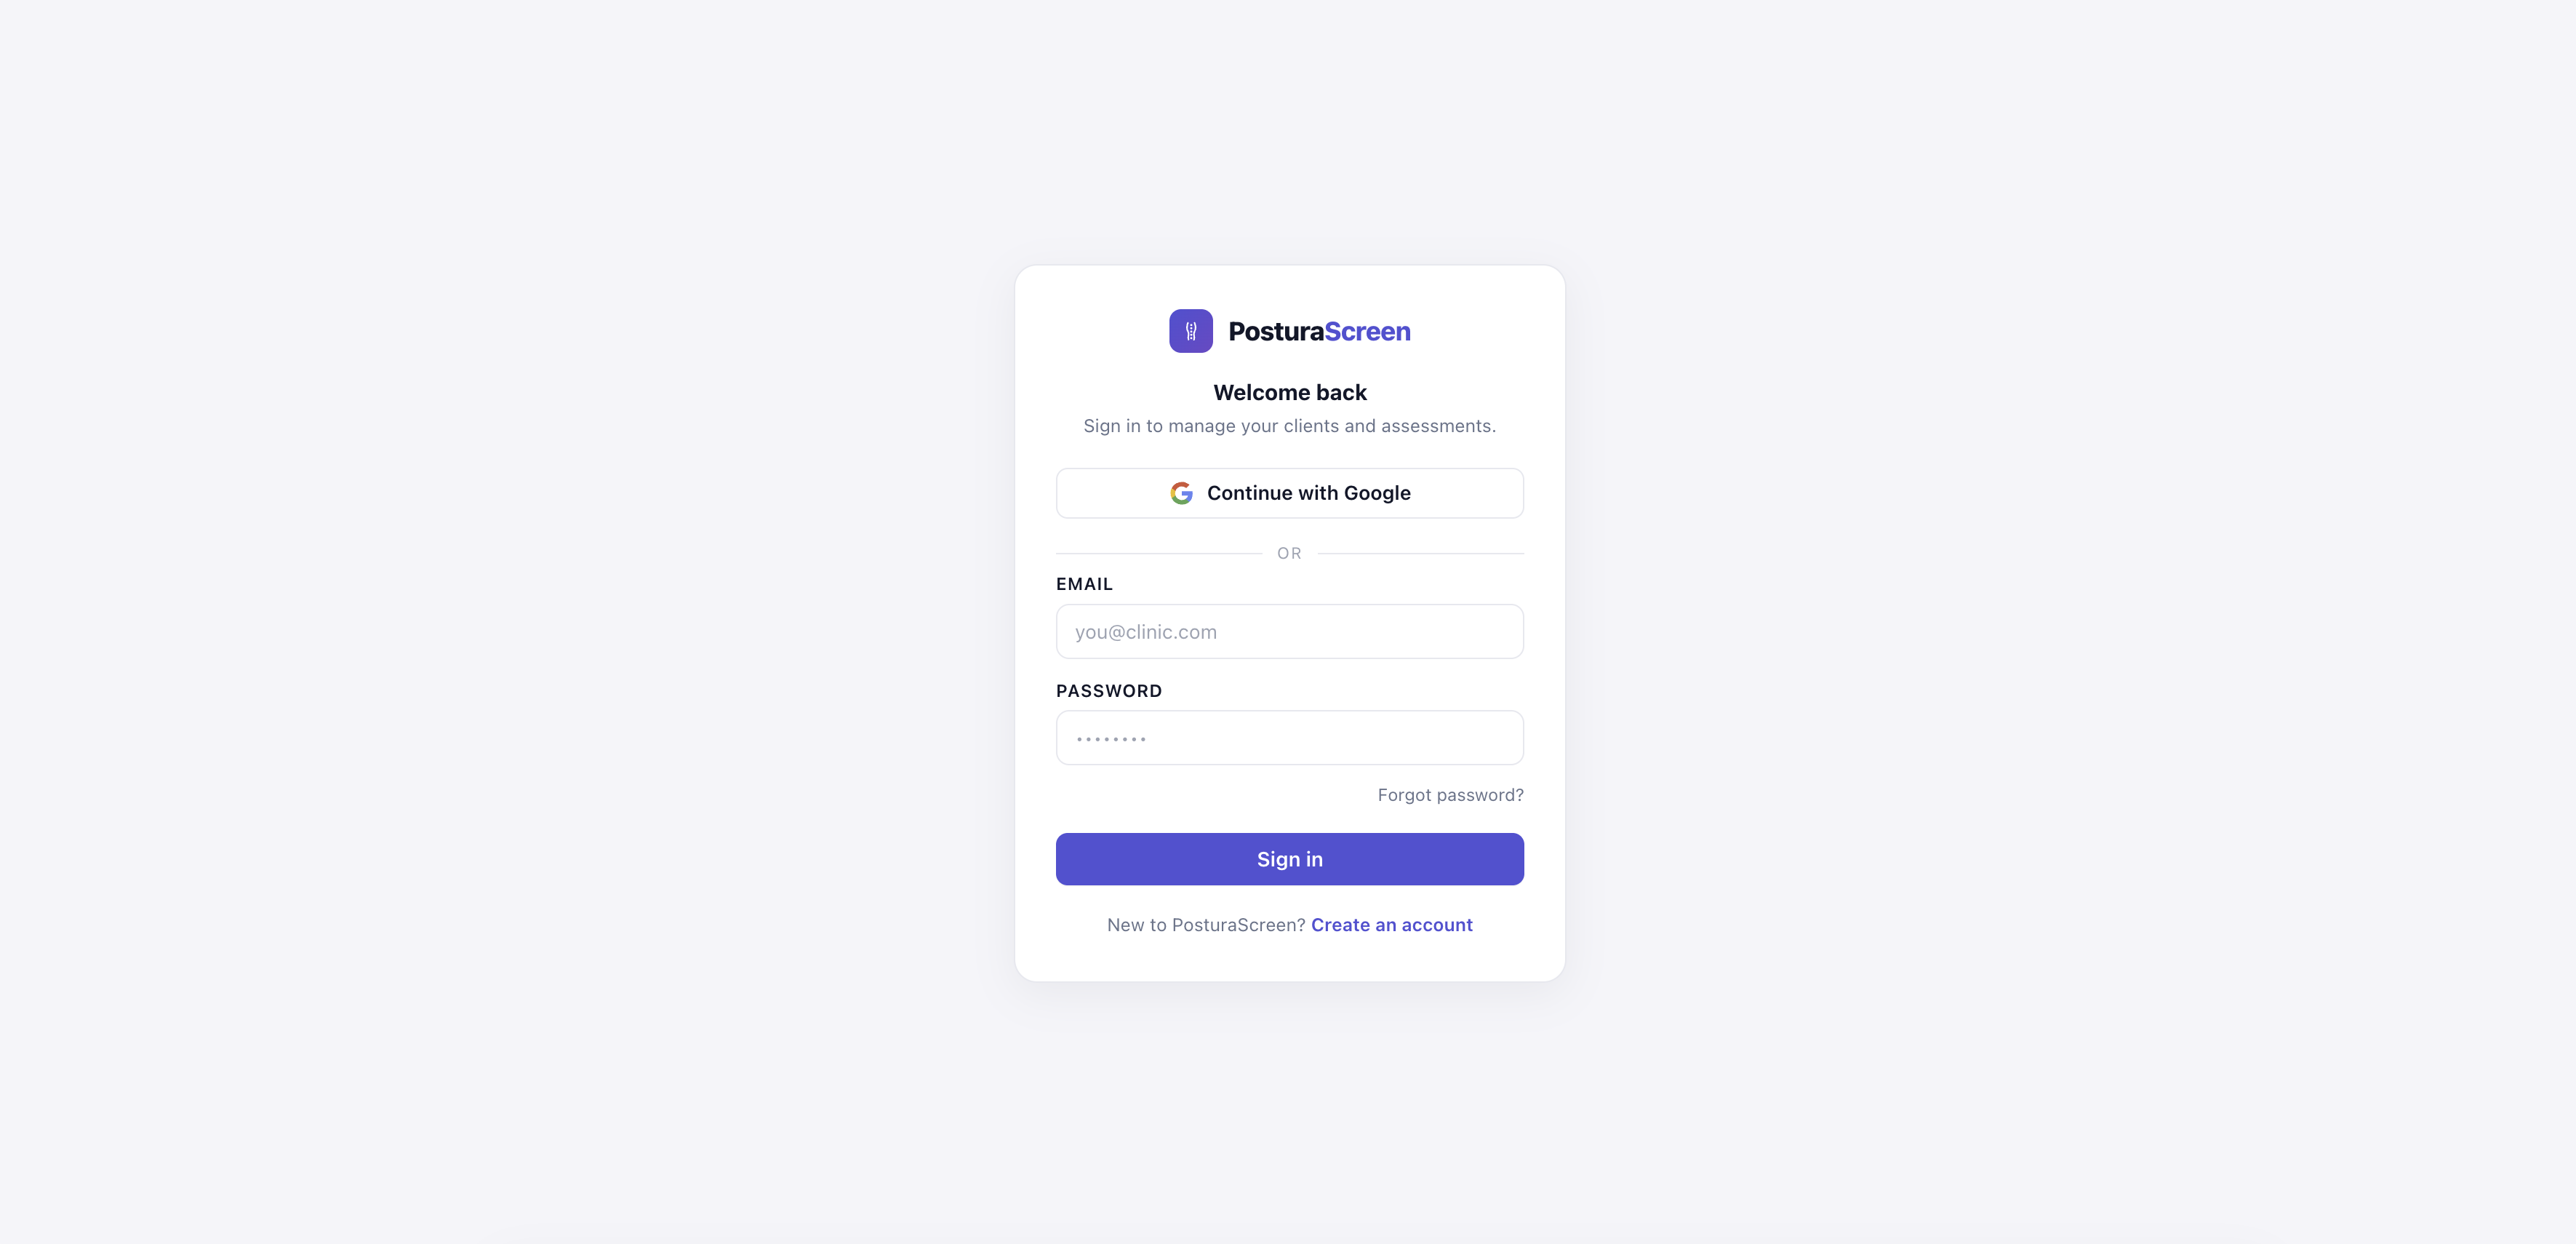
Sign in (or create a free account)

Go to app.posturascreen.com and either continue with Google or create an account with email + password. The free tier includes every feature — no credit card.

You'll see: a sign-in screen, then your empty dashboard with a + New client button on the top right.
PosturaScreen sign-in screen at app.posturascreen.com
The sign-in screen — continue with Google or use email + password.
2

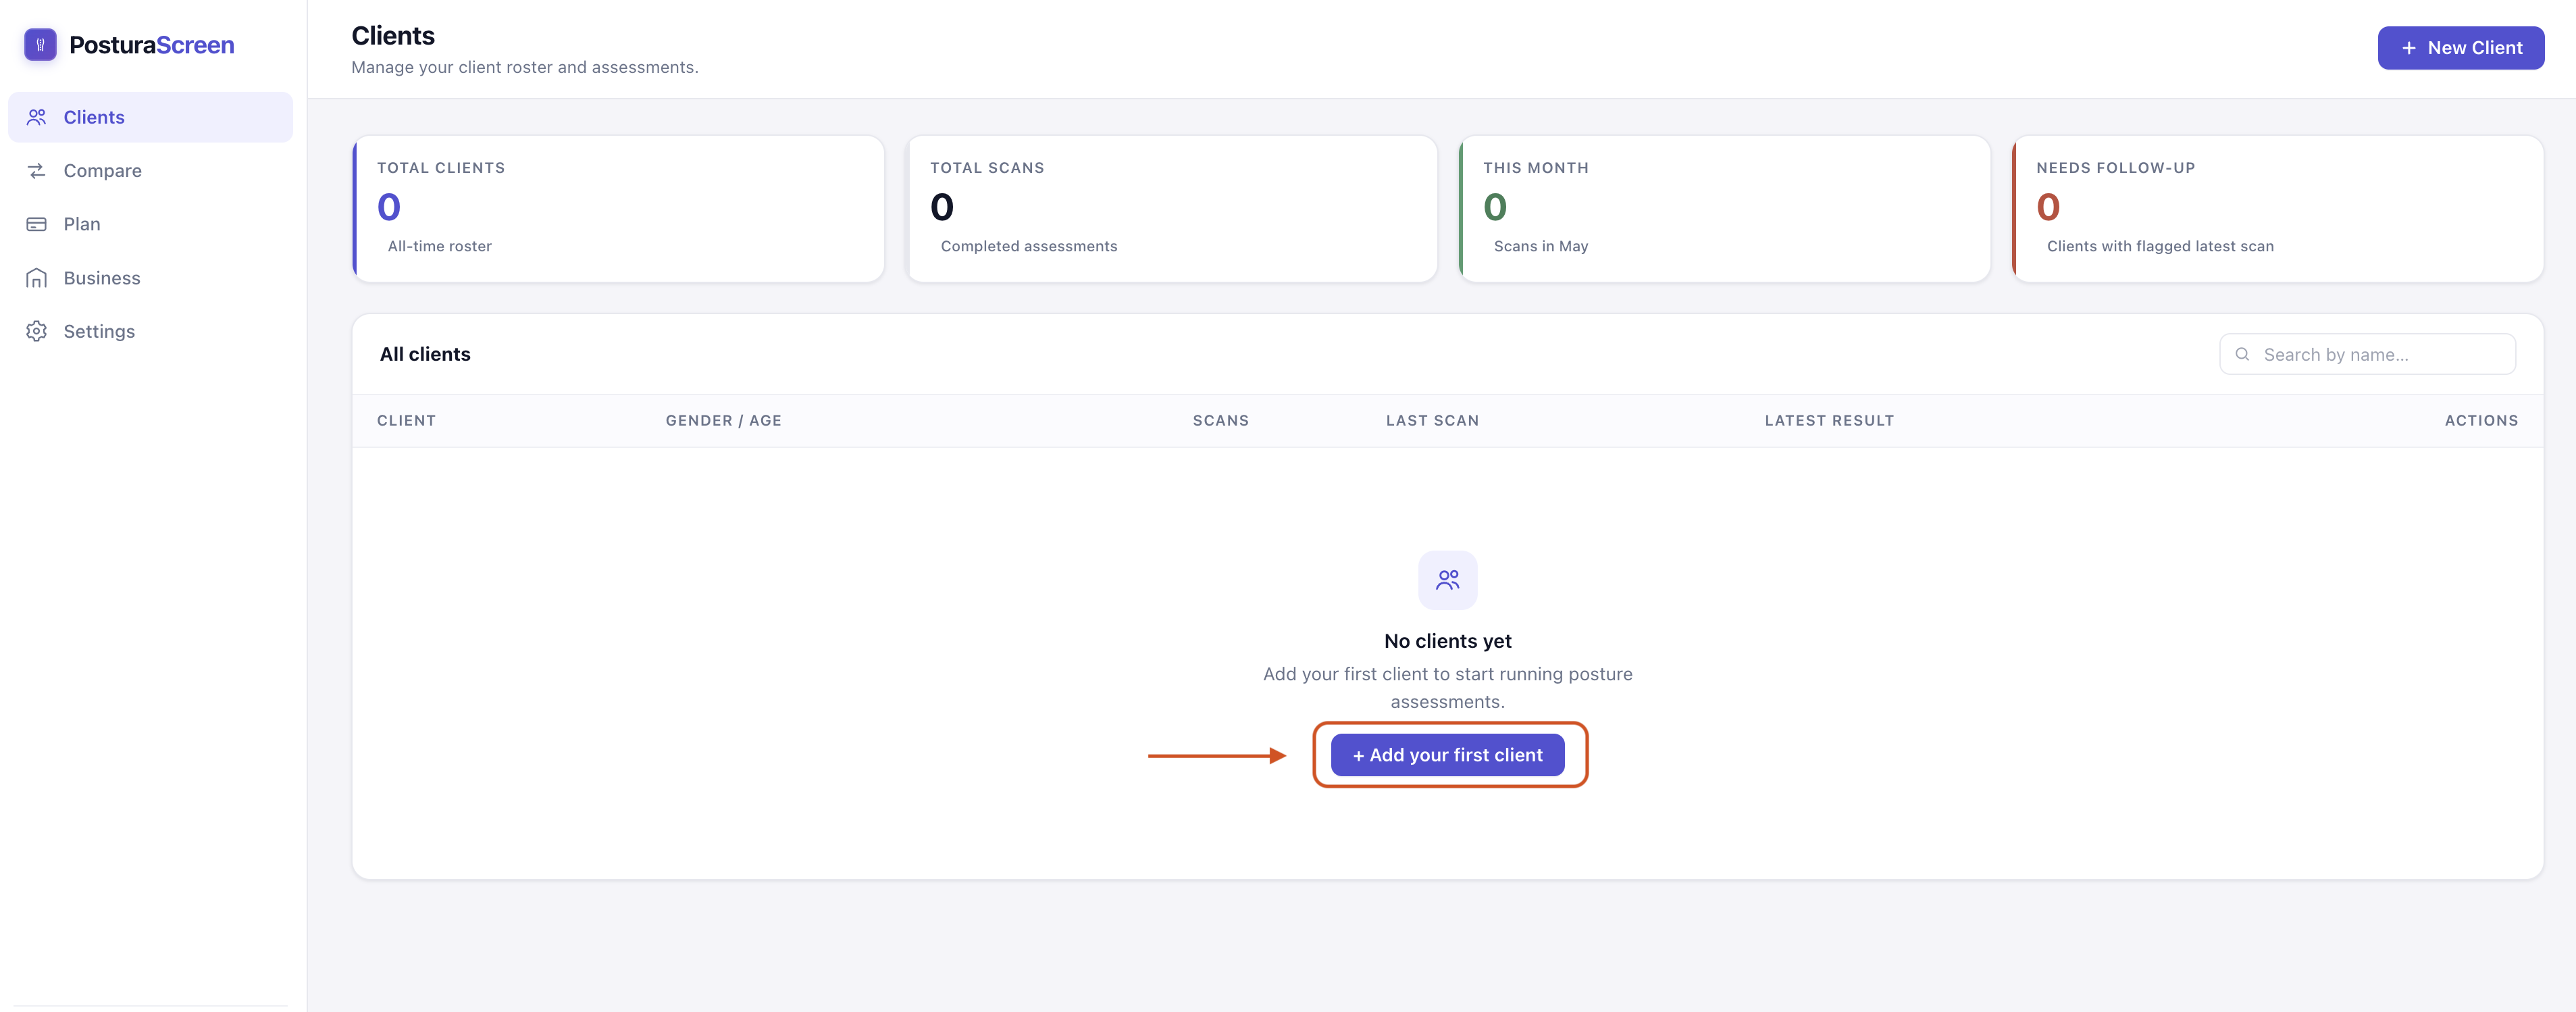
Add the person you're screening

Click + New client on the dashboard. Enter Name, Gender (used by gender-aware metrics like Q-angle), and Age. Hit Create client.

Clinic Add one entry per client. Every future assessment links back to the same profile, so you can track progress over time.

Solo Add yourself (or a family member) as a “client” — same screen, you're just the one being screened. Use your own name and details.

You'll see: the new profile in your dashboard list. Click it to open the profile page, where the next step lives.
PosturaScreen New Client modal with Name, Gender, and Age fields
Adding a new client — Name, Gender (used by gender-aware metrics like Q-angle), and Age.
3

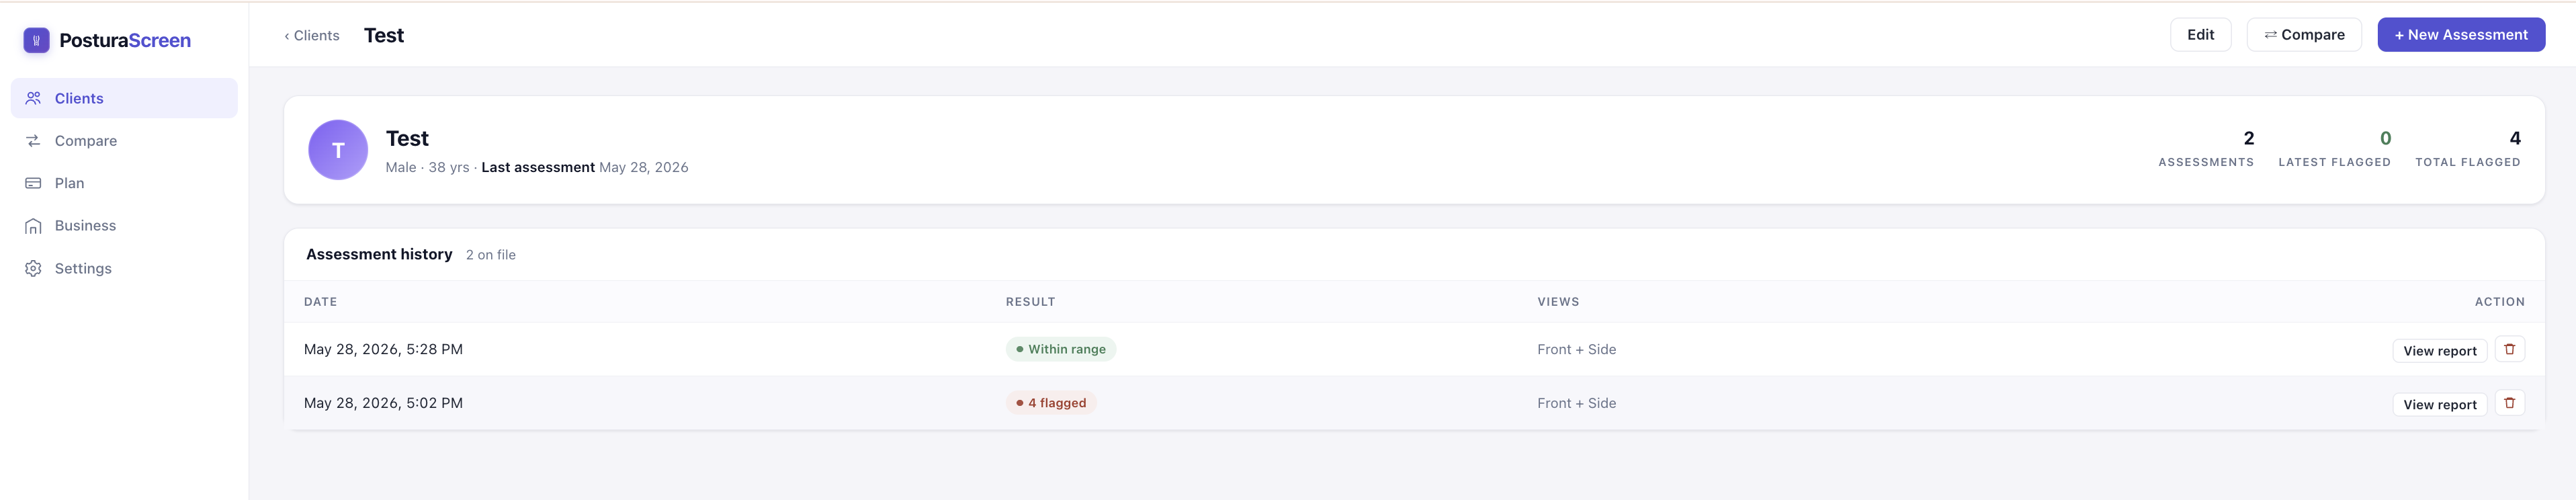
Start a new assessment

On the profile page, click + New Assessment (top right). This creates a fresh record that your photos and results attach to.

You'll see: the New Assessment screen — an upload area on the left, and a QR code on the right labelled “Capture with your phone”.
Client profile page with assessment history and toolbar
A client profile — toolbar (Edit, ⇄ Compare, + New Assessment) and the assessment history list.
4

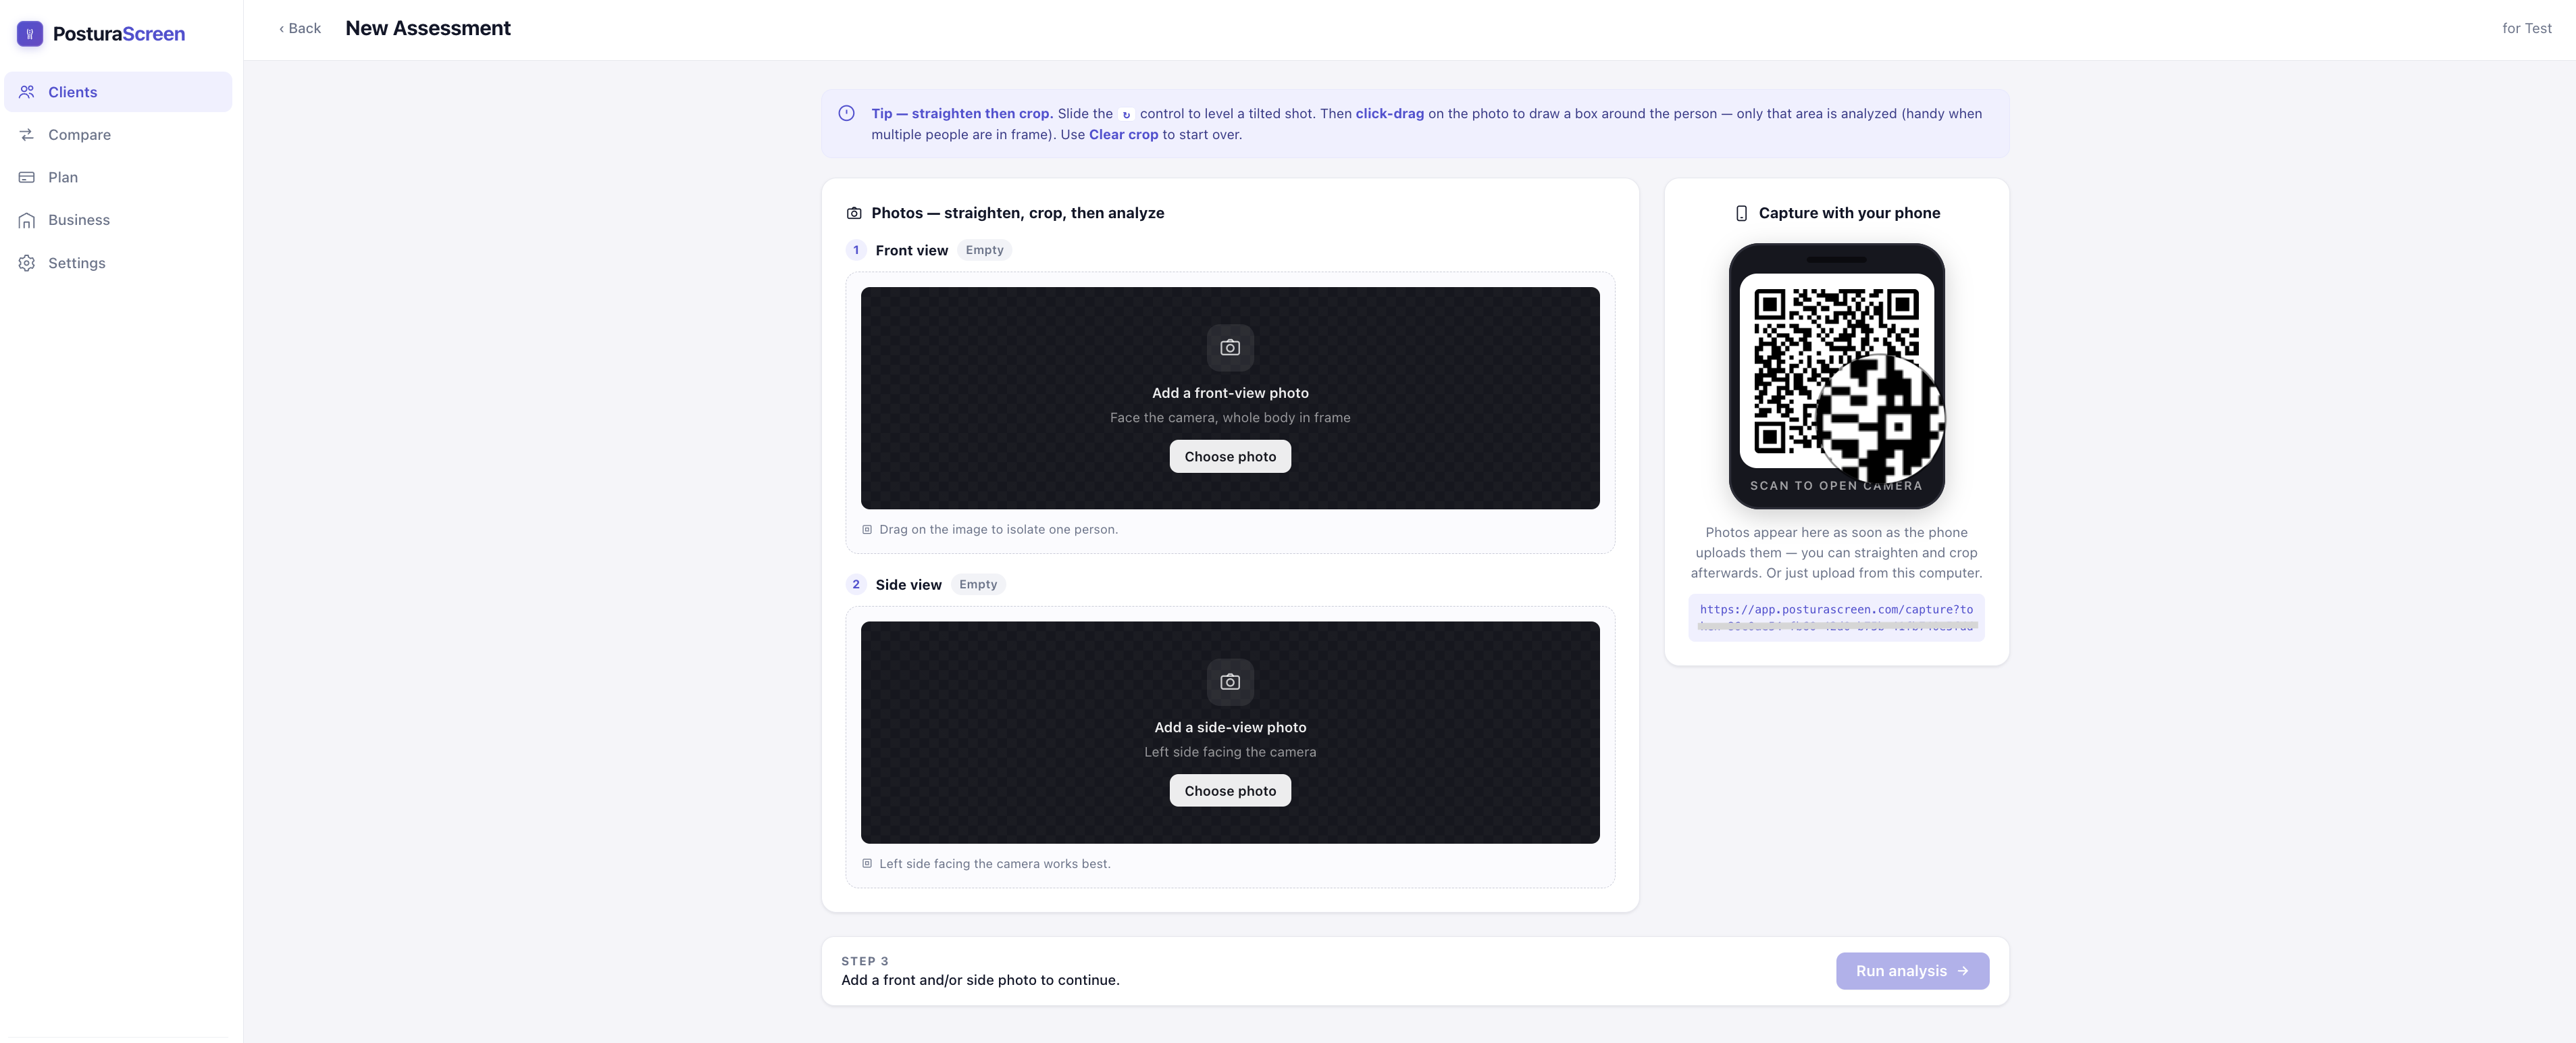
Capture a front and a side photo

You need two photos: front view (facing the camera) and side view (standing fully side-on). Two ways to capture them:

By phone (recommended)

Point any phone's camera at the QR code on the right of the screen. It opens a capture page — no app install, no login. Take the front photo, then the side photo, then hit Done. The images appear on your computer automatically.

Upload from your computer

If you already have the photos, click Choose photo in the “Add a front-view photo” and “Add a side-view photo” boxes on the left. JPG or PNG, any size.

Before you shoot: skim the photo tips below — they prevent most “no person detected” errors.

You'll see: a thumbnail of each photo inside the assessment screen, with Replace and Clear crop options. The QR link expires after 30 minutes — refresh the page to get a new one.
New Assessment screen — QR code on the right, upload slots on the left
The New Assessment screen. Left: upload slots for the front and side photos. Right: a QR code to capture with a phone.
5

Run the analysis~5 seconds

Once both photos are in place, click Run analysis. The AI detects 17 anatomical landmarks on each photo and computes the posture metrics, drawing the skeleton on top.

The first run of the day can take up to ~30 seconds while the service warms up. After that it's a few seconds per assessment.

You'll see: a progress indicator, then you're taken straight to the report. If the AI can't find a person, you'll get a “No person detected” message — see the FAQ below.
6

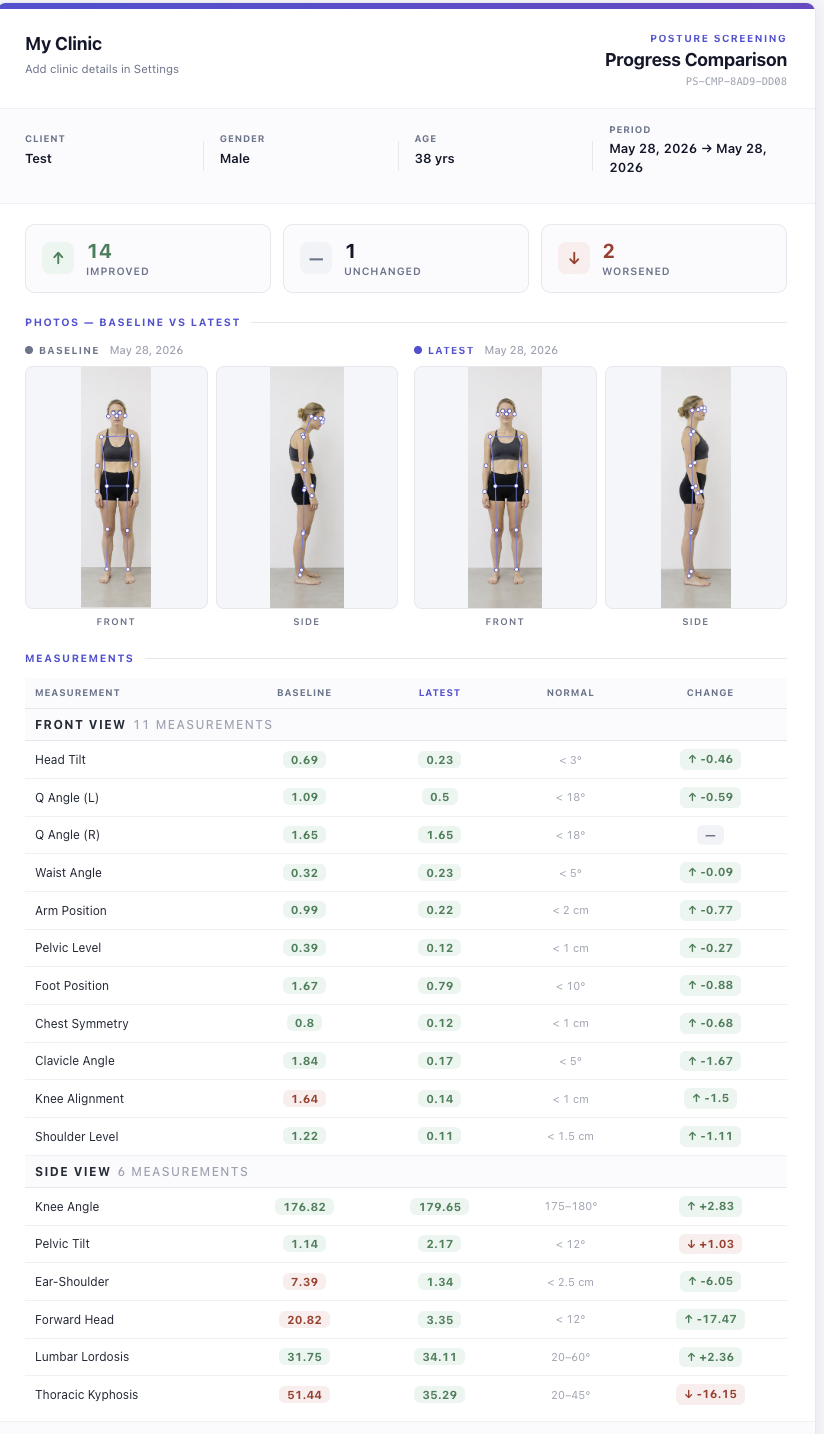
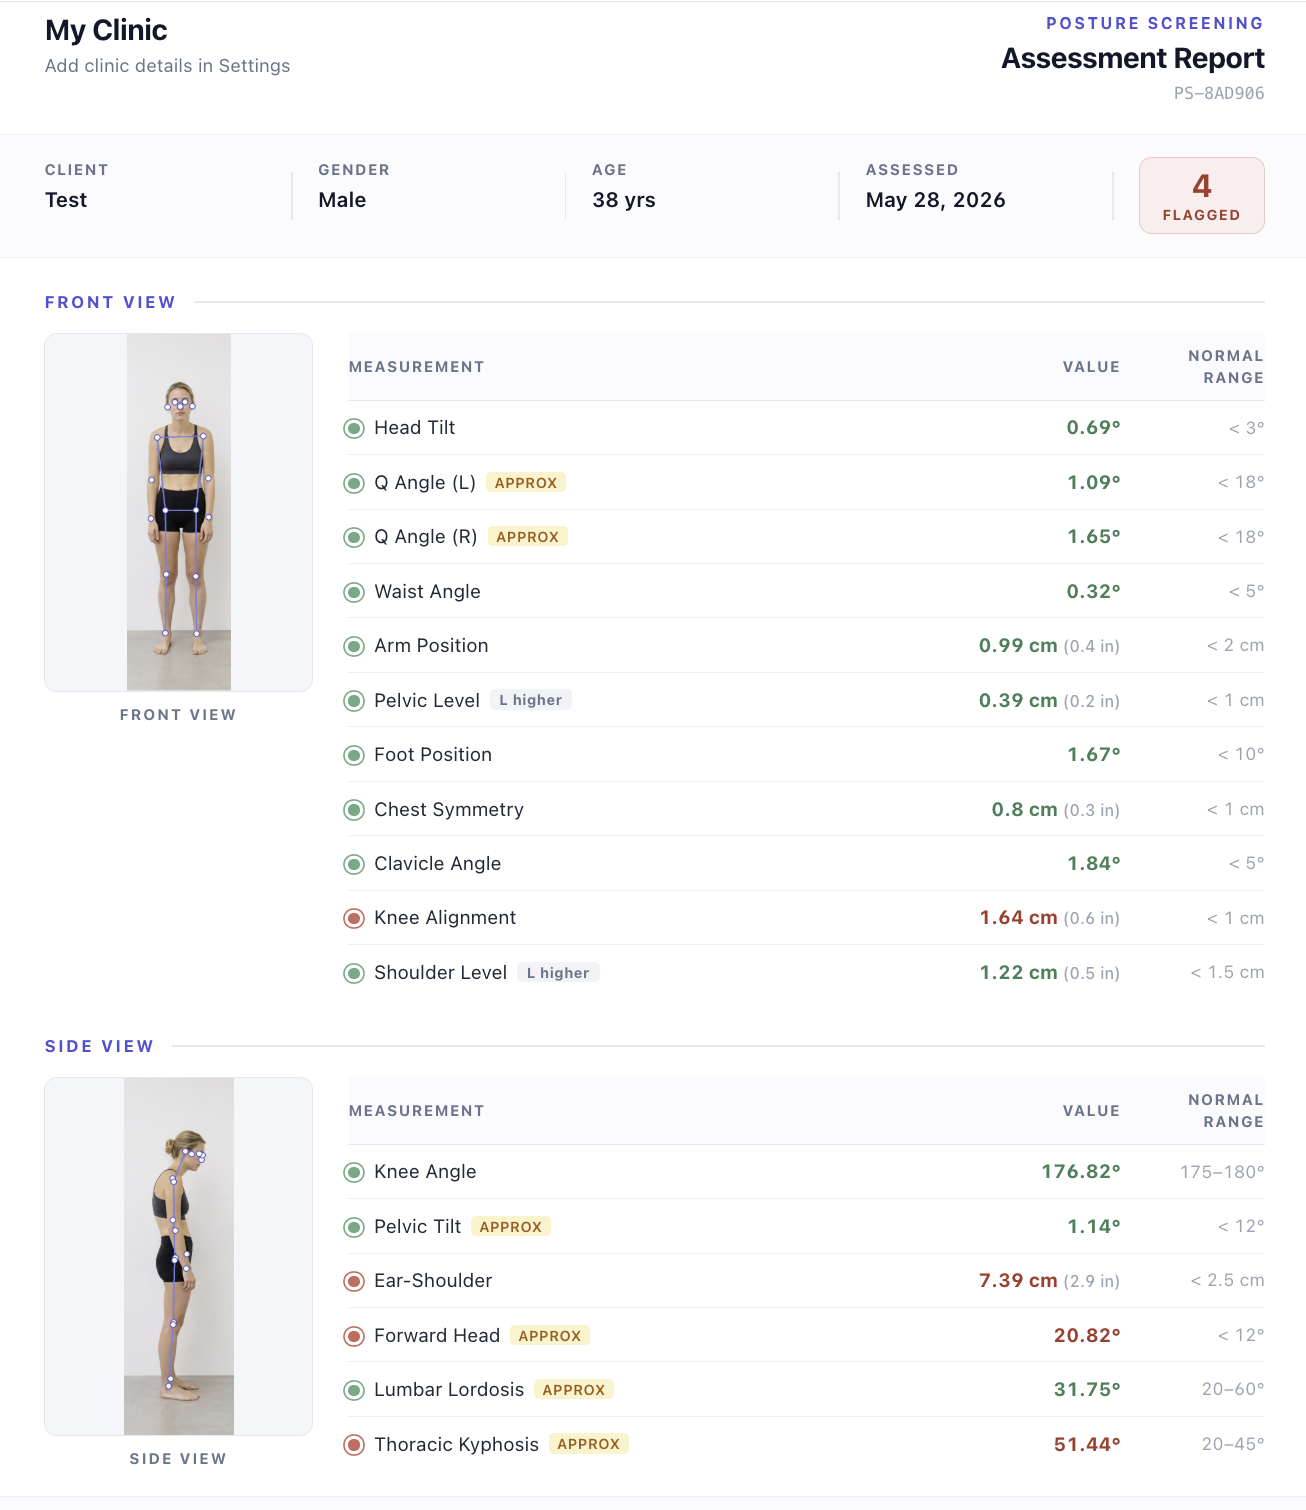
Read the 17-metric report

You get 11 metrics from the front view (head tilt, shoulder level, pelvic level, Q-angle, etc.) and 6 from the side view (forward head, kyphosis, lordosis, pelvic tilt, knee angle). Each row shows the measured value, a normal range, and a flag:

· Green means the value is within the typical range.
· Red means it's outside that range — a screening signal worth a closer look, not a diagnosis.
· The approx tag appears on Forward Head, Thoracic Kyphosis, Lumbar Lordosis, Pelvic Tilt, and Q-angle (L/R) — a 2-D photo can only estimate these.

The annotated photos at the top show the exact landmarks the AI used to compute each metric.

You'll see: the report page with two annotated images at the top and the metrics table below. Scroll the whole page before deciding what to discuss.
PosturaScreen assessment report, page 1 — annotated photos and full 17-metric table
Report — page 1. Clinic header, client meta, the annotated front and side photos, and every one of the 17 metrics with value, normal range, and a green/red flag. APPROX tags appear next to the five estimated metrics.
7

Save as PDF and share

Click Print / PDF on the report. It produces a two-page printable layout: page 1 carries the annotated photos and the full 17-metric table; page 2 summarises just the flagged measurements with a one-line explanation of each.

Clinic Hand the PDF to the client at the end of the session, or email it. The PDF is your clinic's branded report.

Solo Save the PDF for your records, share it with your trainer or physio, or just keep it as a baseline to compare against next time.

You'll see: the browser's print dialog with a two-page preview. Choose “Save as PDF” as the destination if you want a file instead of a printout.
PosturaScreen assessment report, page 2 — flagged-metrics summary
Report — page 2. A clean summary of just the flagged measurements. Each line states the value, the normal range, and a 
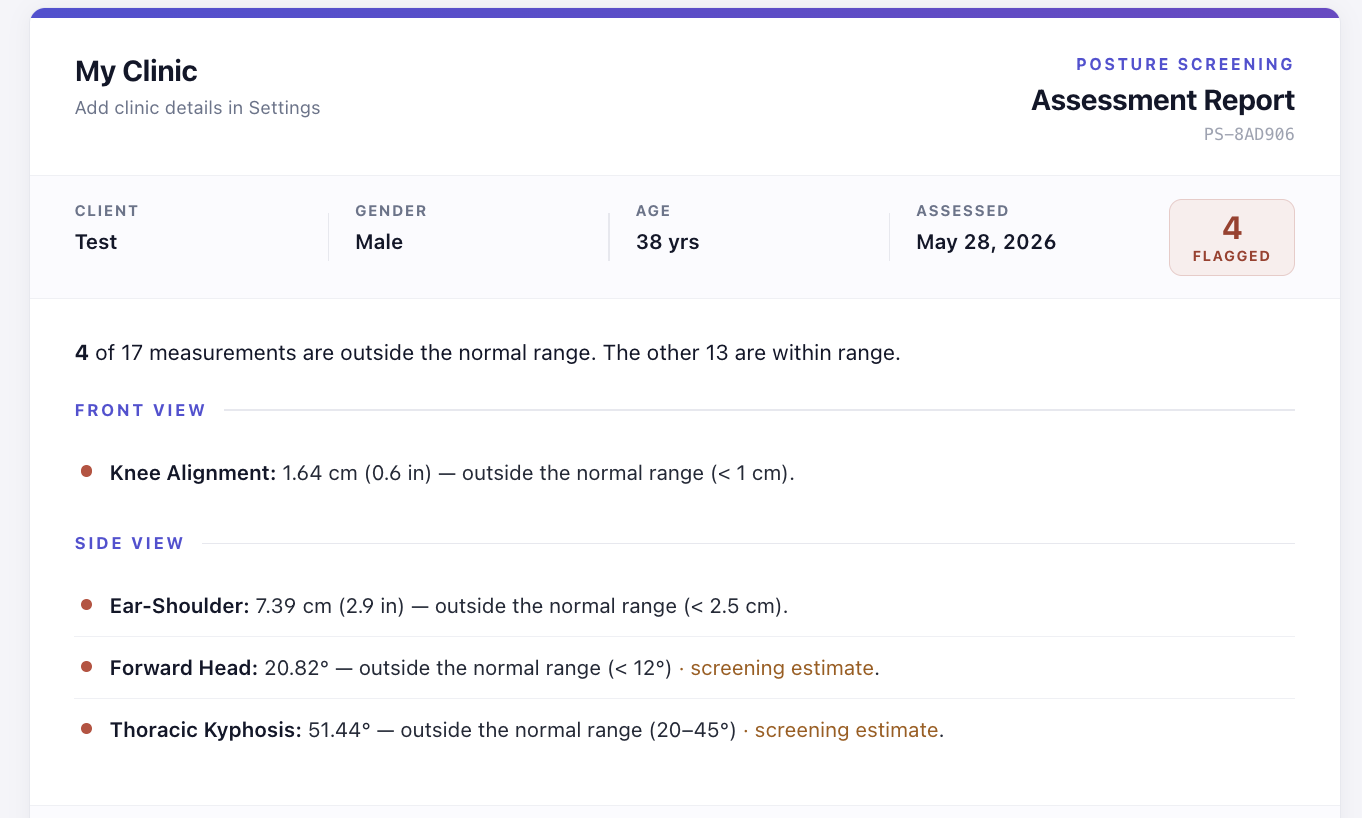
screening estimate tag where the metric is approximated from a 2D photo.
8

Re-screen later and compare

Every 4–6 weeks, run a second assessment for the same profile. Then open the profile, click ⇄ Compare, pick the two assessments, and see each metric side by side — baseline vs latest, with the delta.

Metrics that improved show in green, ones that worsened in red. This is the artefact that turns a one-off photo into a programme.

You'll see: the Compare screen with two report columns and a difference column. You can Print / PDF this too.
PosturaScreen Compare view — baseline vs latest assessment with deltas
The Compare view — baseline and latest, side by side, with the delta for each metric. Improvements in green, regressions in red.
Photo tips

Get a clean, full-body shot.

Most “no person detected” errors and odd readings come down to the photo. A few seconds of setup makes the analysis far more reliable.

Whole body in frame — head to feet, nothing cut off.
Plain background — a clear wall, no clutter behind.
Even lighting — avoid strong backlight or harsh shadows.
Form-fitting clothing — so body contours are visible.
Stand naturally — don't “fix” the posture for the photo.
Camera at hip height, ~2–3 m away, held level.
Front: face the camera squarely, arms relaxed at the sides.
Side: stand fully side-on, whole body visible.
FAQ

Common questions & troubleshooting.

I get "No person detected" when I run analysis. What now?
The AI couldn't find a full human body in the photo. Re-take the photo with the whole body in frame (head to feet), a plain background, and even lighting. Loose, baggy clothing or strong backlight are the two most common causes. The photo tips above cover this in full.
The QR code on my screen — my phone won't open it.
Open your phone's built-in camera app and point it at the QR code (no app needed). If nothing happens, the phone and computer must be online — the capture link works over the internet, not just Wi-Fi. The link expires after 30 minutes; if it's been longer, refresh the assessment page to generate a fresh QR.
What does the "approx" tag on some metrics mean?
Five metrics are tagged approx — Forward Head, Thoracic Kyphosis, Lumbar Lordosis, Pelvic Tilt, and Q Angle (L/R). A single 2-D photo can't directly measure these the way an X-ray or 3-D scan can, so we estimate them from joint angles. They're reliable for screening and tracking change over time, not for a clinical diagnosis.
A metric is flagged red. Does that mean something is wrong?
Red means the measurement falls outside the typical range for that metric — it's a screening signal, not a diagnosis. Use it as a starting point for a closer look. Green means within the normal range based on published references.
How often should I re-screen?
For tracking progress with an active program, every 4–6 weeks is a good cadence — long enough for soft-tissue change to show, short enough to stay motivating. For a yearly check-in, once or twice a year is fine.
Are the photos and reports private?
Yes. Photos and assessments are scoped to your account — only you can see your own clients and reports. See the privacy page for details.

Ready to run your first screen?

Free during early access — every feature unlocked, no credit card.

Start free