How to Use PosturaScreen: A Step-by-Step Walkthrough
PosturaScreen turns a front and side photo into a 17-metric posture report in about a minute. This guide walks through the whole flow — from the first sign-in to a printable PDF — and explains what to look at in the report. It works the same way whether you are a clinician screening clients or an individual screening yourself.
- Workflow: sign in → add a profile → start an assessment → capture two photos → run analysis → read the report.
- The PC is the main screen; the phone is just the camera — scan a QR, take two photos, no app to install.
- Each assessment returns 17 metrics (11 front, 6 side) with normal ranges and green/red flags.
- Five metrics carry an
approxtag — they are estimates from a 2D photo, best used to track change over time. - Run a second assessment after 4–6 weeks and use the Compare view to see what improved.
Before you start
You need three things: a desktop or laptop with a browser, a phone with a camera, and somewhere to take a clean photo — a clear wall is enough, two metres of clear floor in front of it, and even lighting. The whole flow takes about two minutes once you’re set up, most of which is the photo itself.
PosturaScreen runs in the browser, so there is nothing to install on either device. The phone and computer just need to be online when the photos sync.
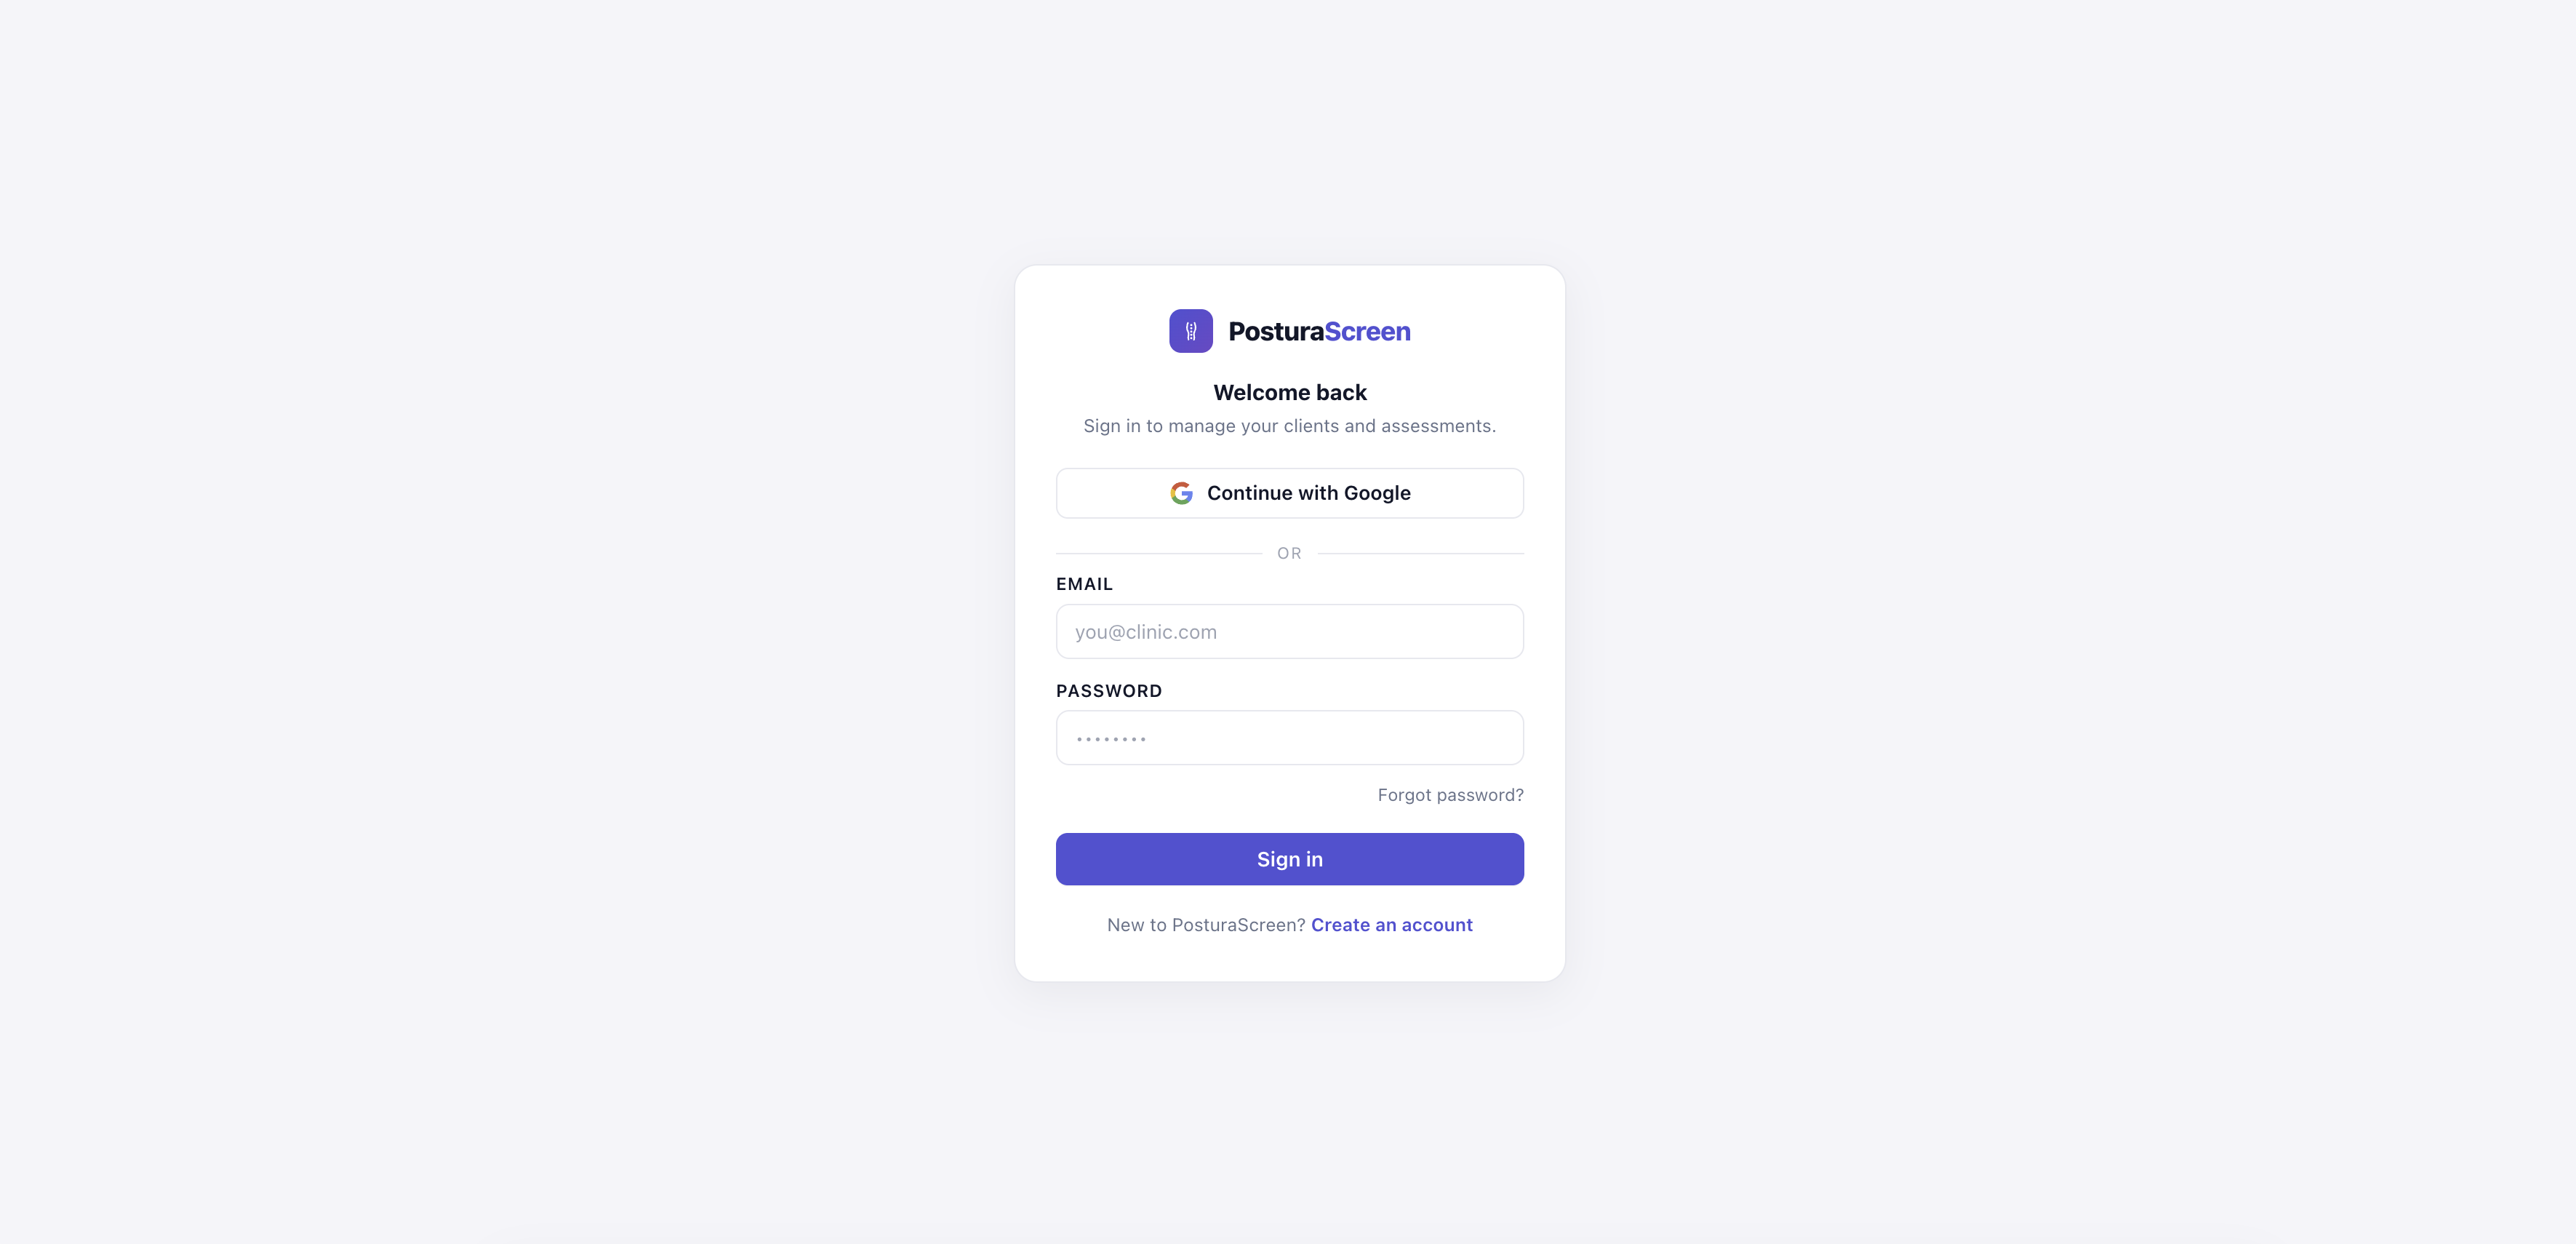
Step 1 — Sign in
Go to app.posturascreen.com. Sign in with Google with one click, or create an account with email and password. The free tier includes every feature — no credit card.
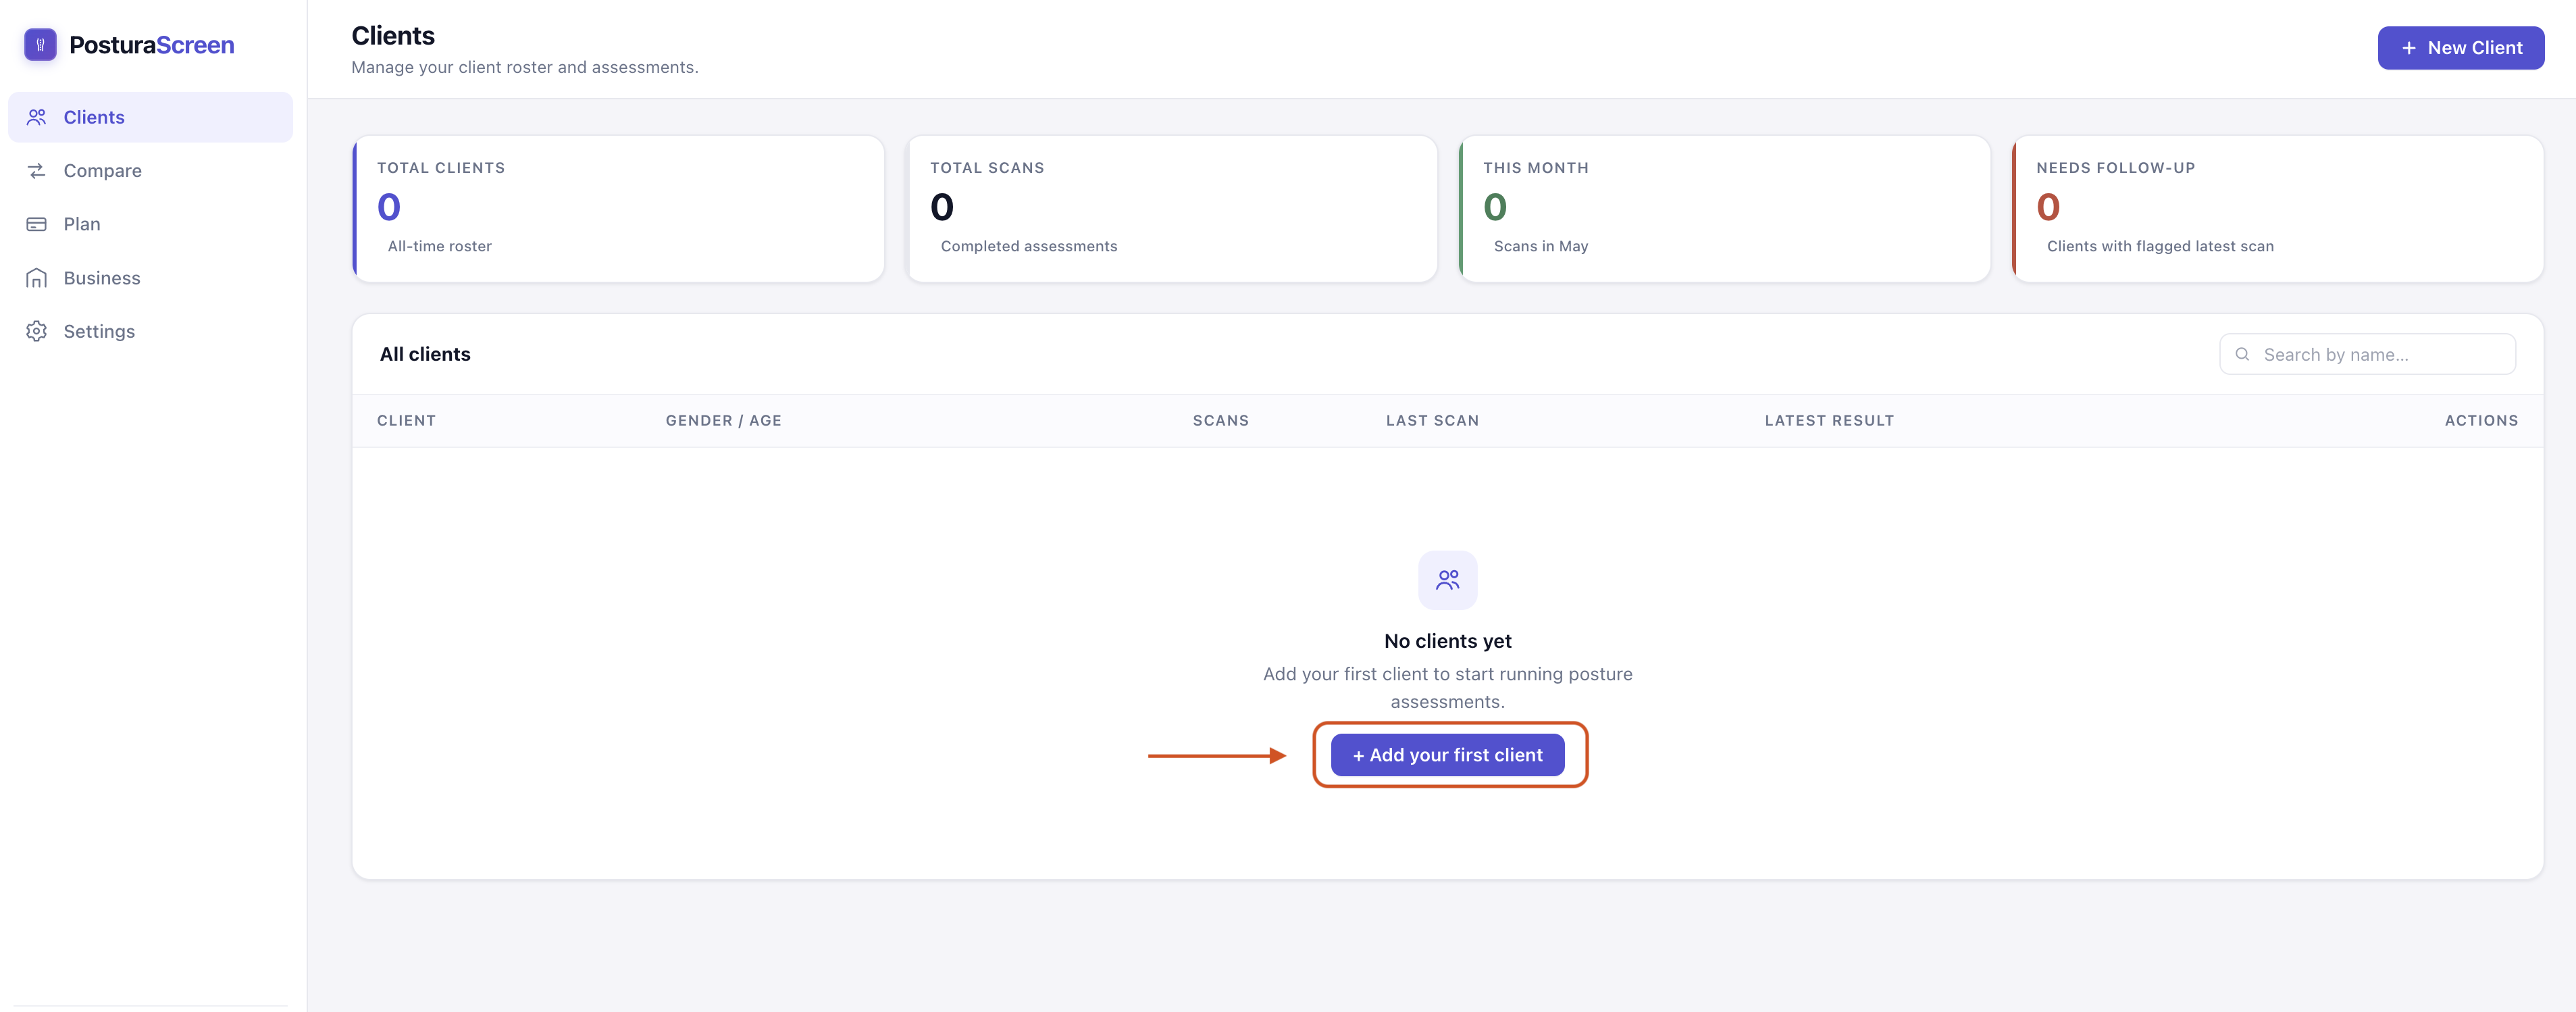
After signing in you land on your dashboard. If you have used the app before, your clients appear in a list. If this is your first time, the list is empty with a + Add your first client button.
Clinic Each clinician account has its own dashboard and clients. Other accounts in your clinic cannot see your records.
Solo The same dashboard works — you’ll add yourself as the only “client” in the next step.
Step 2 — Add the person being screened
Click + New client on the top right. The dialog asks for Name, Gender, and Age.
- Gender is used by gender-aware metrics — the normal range for Q-angle, for example, is wider for women than men. It is not displayed prominently on the report.
- Age appears on the report and helps you organise the list later.
Hit Create client. The new profile appears in your dashboard list.
If you are screening yourself, just enter your own details — you are the “client”. Despite the label, the data stays in your own account; nobody else can see it.
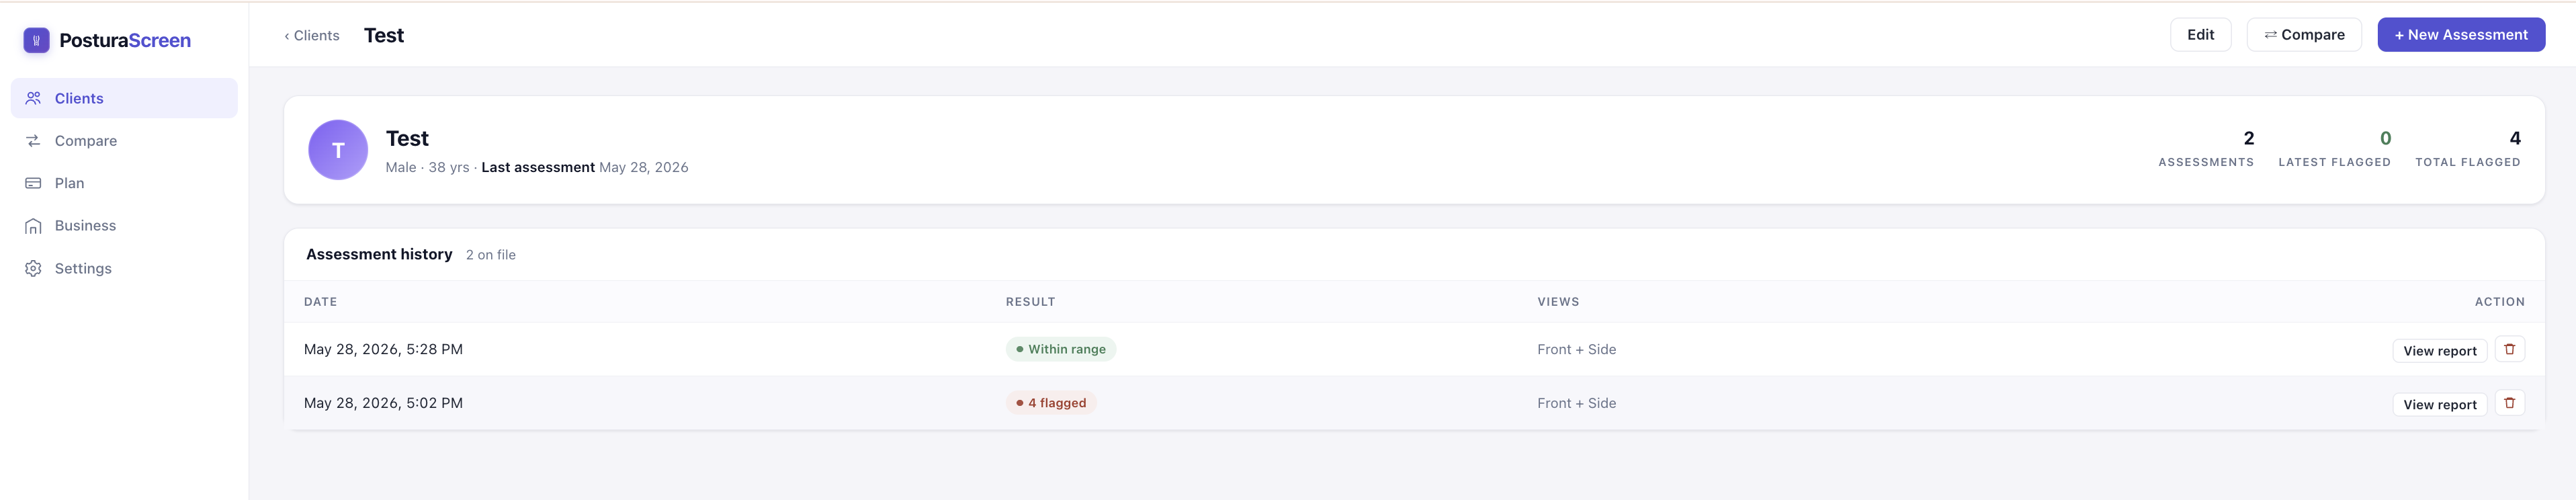
Step 3 — Start a new assessment
Click the profile to open it. You’ll see the client’s history (empty for a new profile) and a + New Assessment button in the top right. Click it.
Each assessment is its own record. A client can have as many assessments as you like — that is how progress tracking works later.
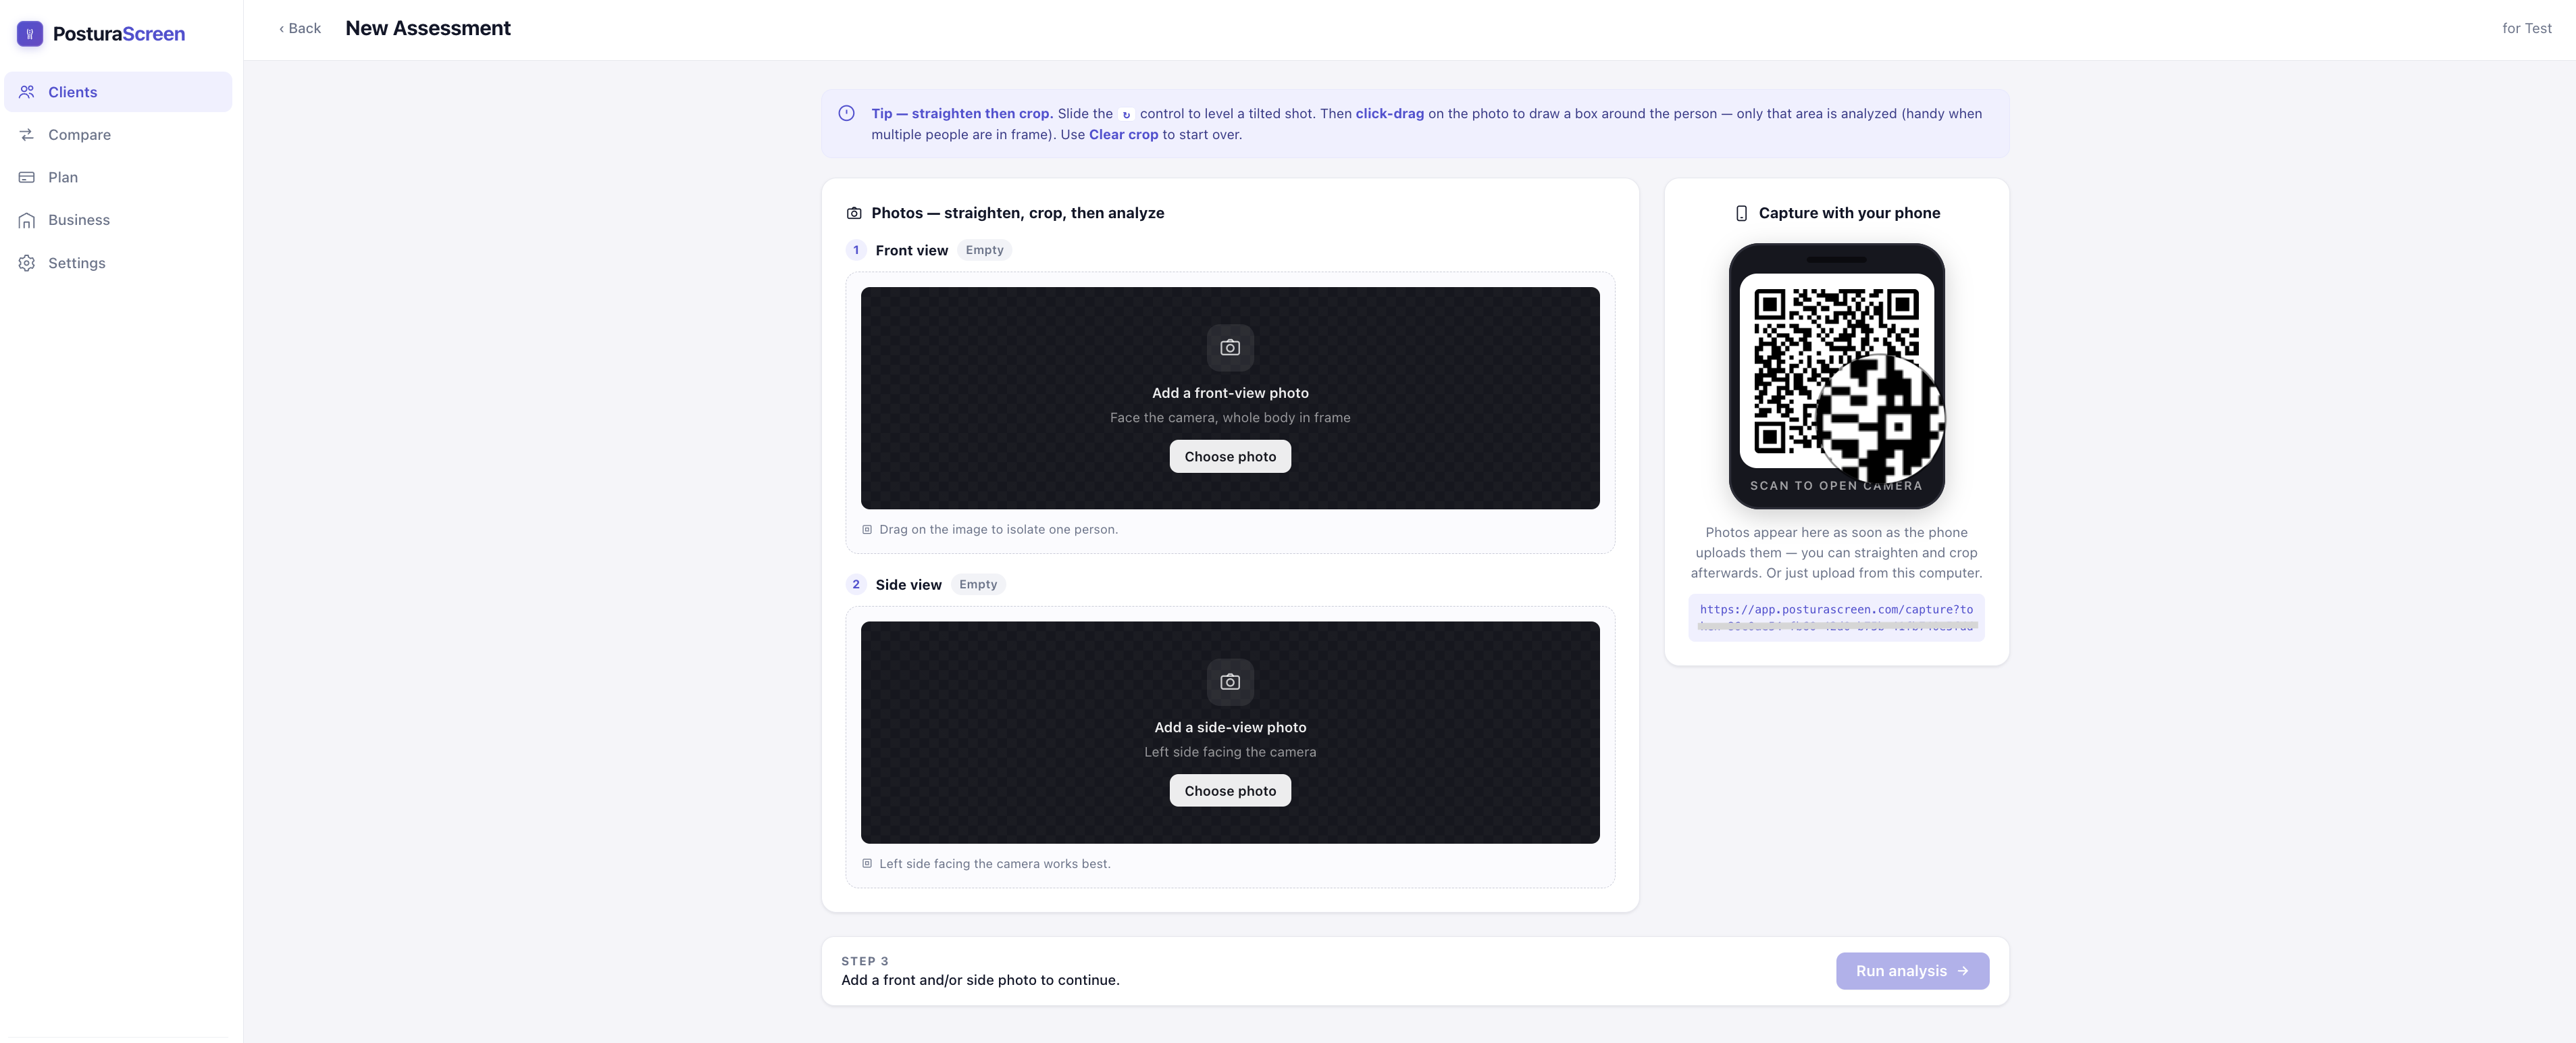
Step 4 — Capture a front and a side photo
You need exactly two photos: front (the person facing the camera squarely) and side (the person fully side-on). Both must show the whole body, head to feet.
Option A — by phone (recommended)
Open your phone’s built-in camera app and point it at the QR code on screen. A capture page opens in the phone’s browser — no app install, no login. There you’ll see two buttons for the front photo: a camera button (opens the camera directly) and a gallery button (picks an existing photo). Take or pick the front photo, confirm it, then do the same for the side photo. Hit Done.
As soon as each photo uploads, it appears on the computer screen automatically. You can crop or replace either one before running the analysis.
The QR link is single-purpose and expires after 30 minutes. If it has been longer, refresh the assessment page on the computer to generate a fresh QR.
Option B — upload from the computer
If you already have the photos (taken with a separate camera, sent over by email, etc.), click Choose photo in each slot on the left. JPG and PNG both work, any reasonable size.
How to take a good photo
Most of the rare “no person detected” errors come down to the photo. Five rules cover most cases:
- Whole body in frame — head to feet, nothing cut off.
- Plain background — a clear wall, no clutter.
- Even lighting — no strong backlight or harsh shadows.
- Form-fitting clothing so body contours are visible.
- Stand naturally — don’t “fix” the posture for the photo.
Position the camera at hip height, around two to three metres away, held level. For the front view, face the camera squarely with arms relaxed at the sides. For the side view, stand fully side-on with the whole body visible.
Step 5 — Run the analysis
Once both photos are in place, the Run analysis button at the bottom becomes active. Click it.
Behind the scenes, an AI pose-detection model finds 17 anatomical landmarks on each photo — the joints, the centres of the head and pelvis, and so on — then computes the posture metrics from those points. It also draws the skeleton onto a copy of each photo so you can see exactly what it measured.
The first analysis of the day can take up to about 30 seconds while the service warms up. After that it is around five seconds per assessment.
When it finishes, you are taken straight to the report. If the AI cannot find a full body in either photo, you’ll see No human detected. Use a clear full-body photo. — re-shoot following the rules above.
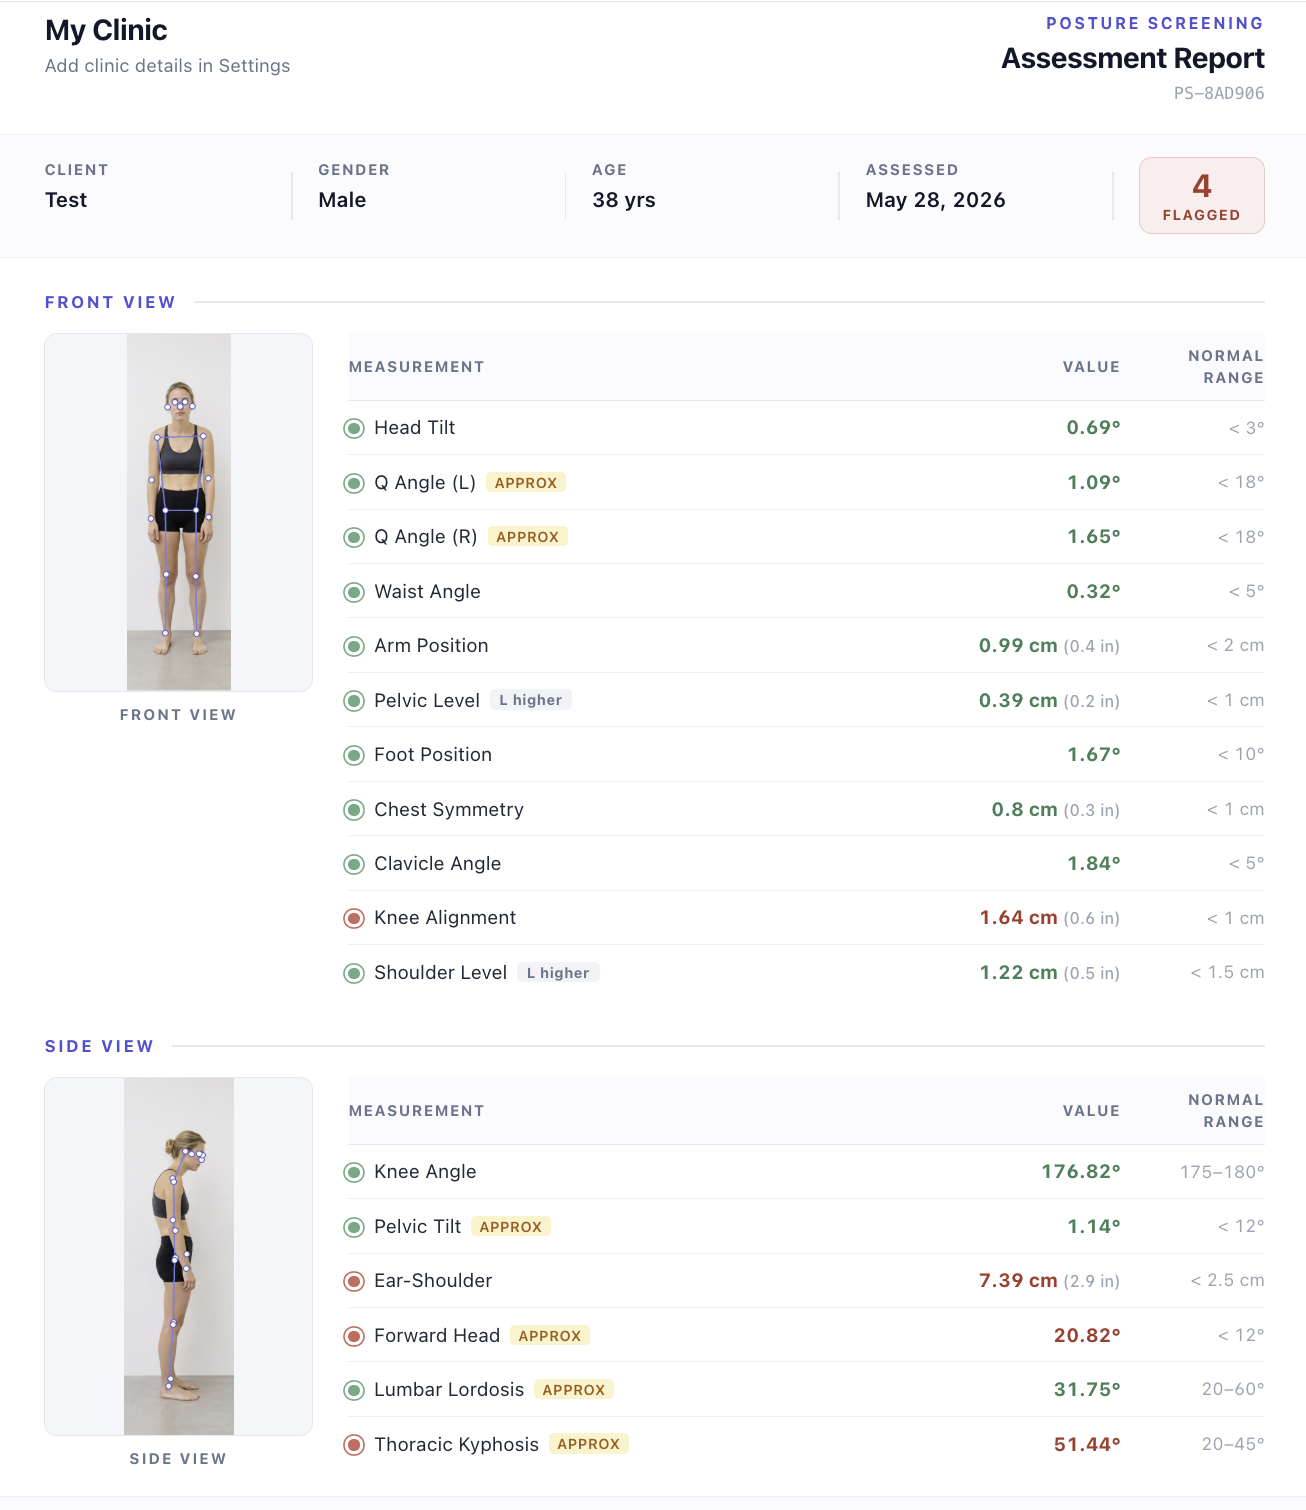
Step 6 — Read the 17-metric report
The report opens on a single page split into two parts:
- Top — two annotated photos with the detected skeleton drawn on top. This is the AI’s “show your work” — useful for spotting cases where it has obviously misread a landmark.
- Below — the 17 metric rows, each with a measured value, a normal range, and a flag.
What the flags mean
- Green means the value falls inside the published normal range for that metric.
- Red means it falls outside the range — a screening signal, not a diagnosis. It is a starting point for a closer look, not an answer in itself.
What “approx” means
Five metrics carry an approx tag: Forward Head, Thoracic Kyphosis, Lumbar Lordosis, Pelvic Tilt, and Q-angle (left and right). The reason is honest: a single 2D photo cannot directly measure these the way an X-ray or 3D scan can. PosturaScreen estimates them from the angles between detected joints, which is reliable enough for screening and for tracking change in the same person over time — but not the right tool for a clinical diagnosis. We tag them so the limitation is on the page where it matters.
The other twelve metrics — head tilt, shoulder level, clavicle angle, chest symmetry, arm position, waist angle, pelvic level, knee alignment, foot position, ear-to-shoulder offset, and knee angle — are direct geometric measurements from the detected landmarks and don’t carry the tag.
APPROX tags appear next to the five estimated metrics.Step 7 — Save as PDF and share
Click Print / PDF in the toolbar. This triggers the browser’s standard print dialog with a two-page layout: the first page carries the annotated photos and the full 17-metric table; the second page is a focused summary of just the flagged measurements, with a one-line explanation of each.
Choose Save as PDF as the destination if you want a file instead of a printout, or pick a printer for a paper copy.
Clinic Hand the PDF to the client at the end of the session or email it. It is written to be readable without you in the room.
Solo Save the PDF as your baseline. Share it with a trainer or physio if you have one, or just keep it for comparing against your next screen.
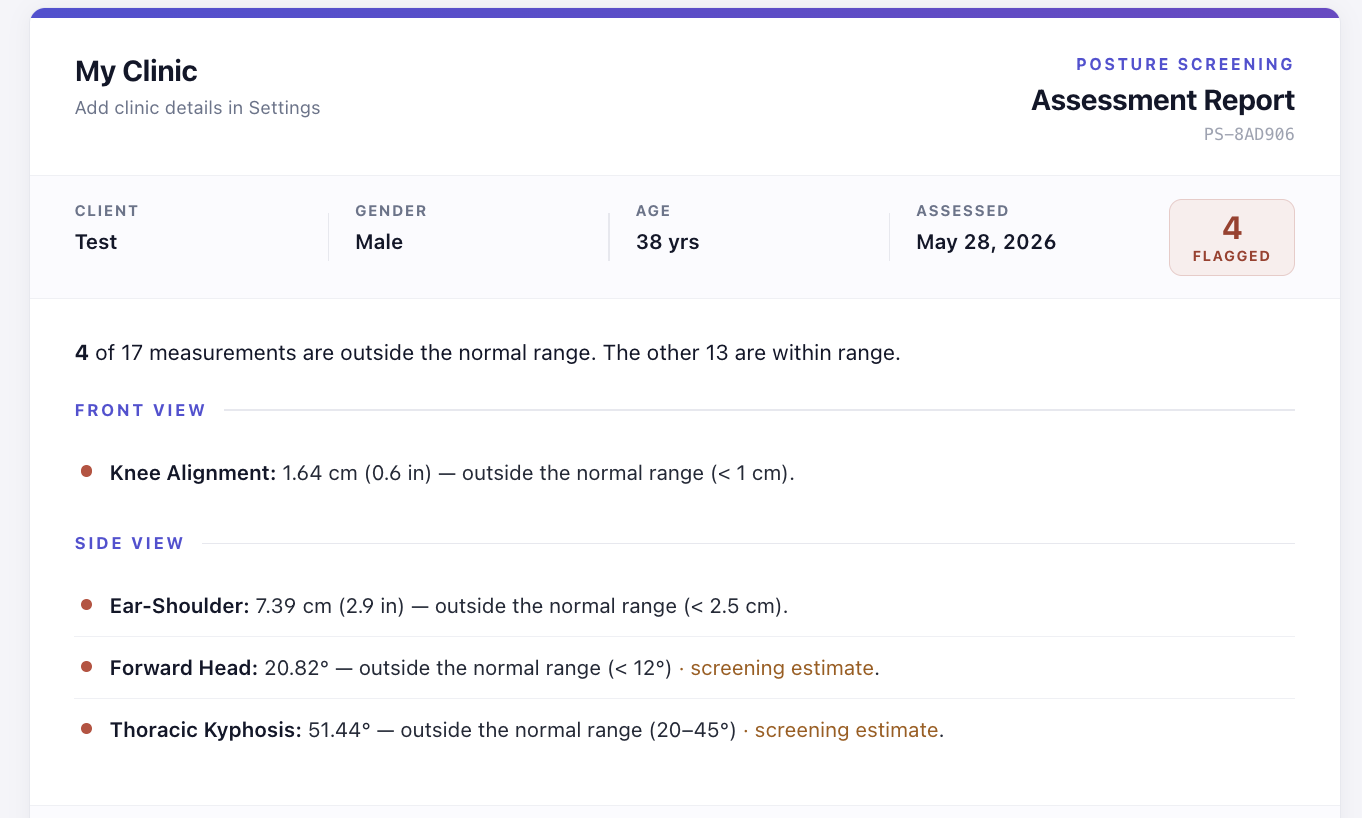
screening estimate tag where the metric is approximated from a 2D photo. Designed to be the page a client actually reads.Step 8 — Re-screen later and compare
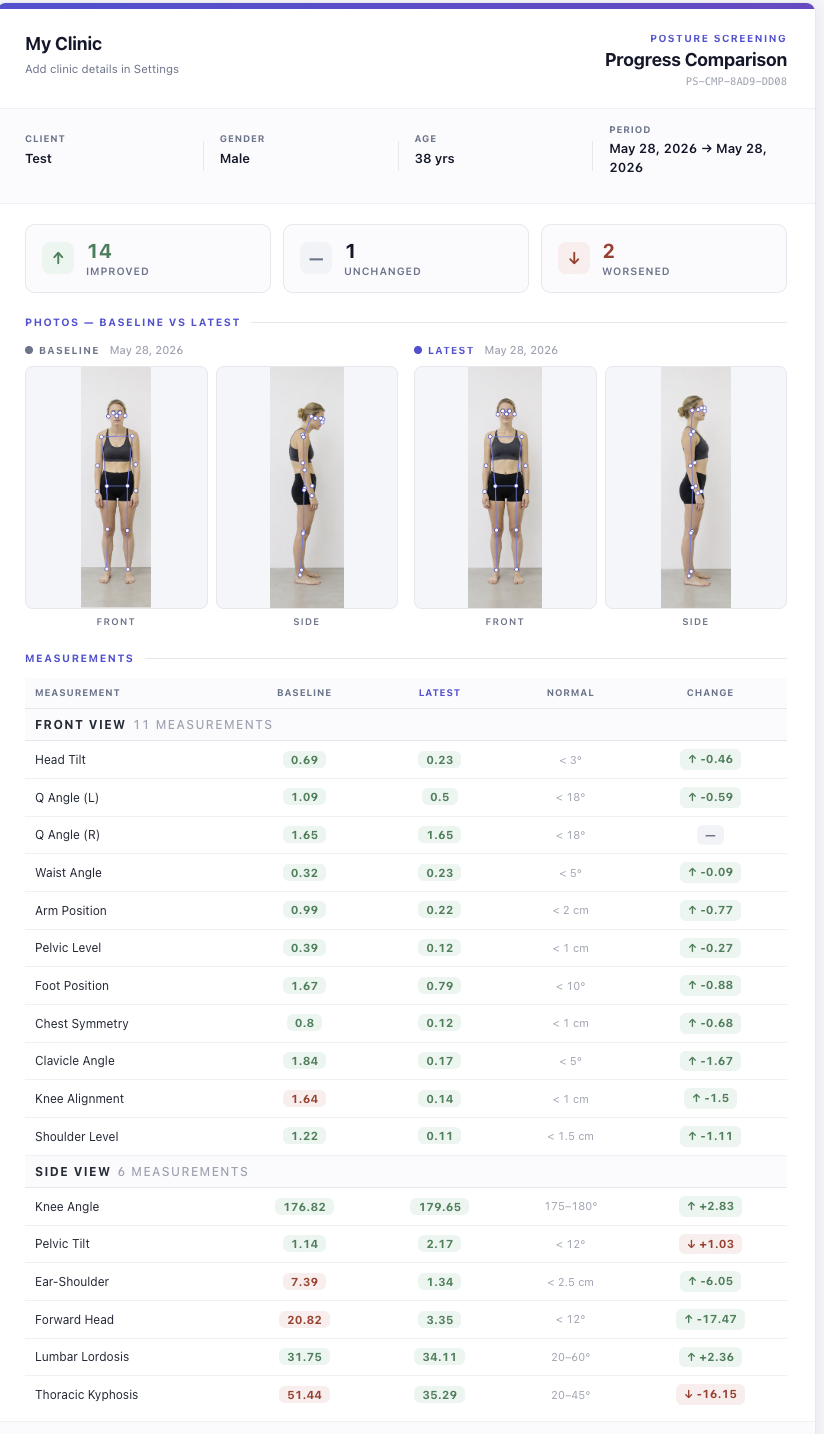
Real value comes from the second assessment, not the first. After four to six weeks of whatever programme the person is on, run a fresh assessment on the same profile.
Then open the profile, click ⇄ Compare in the toolbar, and pick the two assessments you want to compare. The Compare view shows the baseline and the latest side by side, with the delta for each metric: improvements in green, regressions in red.
This is the artefact that turns a one-off photo into a programme. You can Print / PDF the Compare view too — clients see their progress with their own eyes, which is more persuasive than any verbal summary.
How often to re-screen
A few reference points for the cadence:
- Active programme — every 4 to 6 weeks. Long enough for soft-tissue change to register, short enough to stay motivating.
- Maintenance / yearly check-in — once or twice a year is fine.
- Right after a change — if someone has just changed their desk setup, started a new sport, or recovered from an injury, screen at the change and again after six weeks to see whether the change shifted anything.
Where to next
That is the full loop: sign in, add a profile, capture, analyse, read, share, re-screen. From a cold start it takes a couple of minutes. The phone-as-camera + 17-metric report combination is the core of the product — everything else (comparison, PDF, history) is built on top of it.
If you want to go deeper on what each metric actually measures and where the normal ranges come from, see the metrics page and the methodology page.